New research gives insight into designing a world standard ecosystem report card
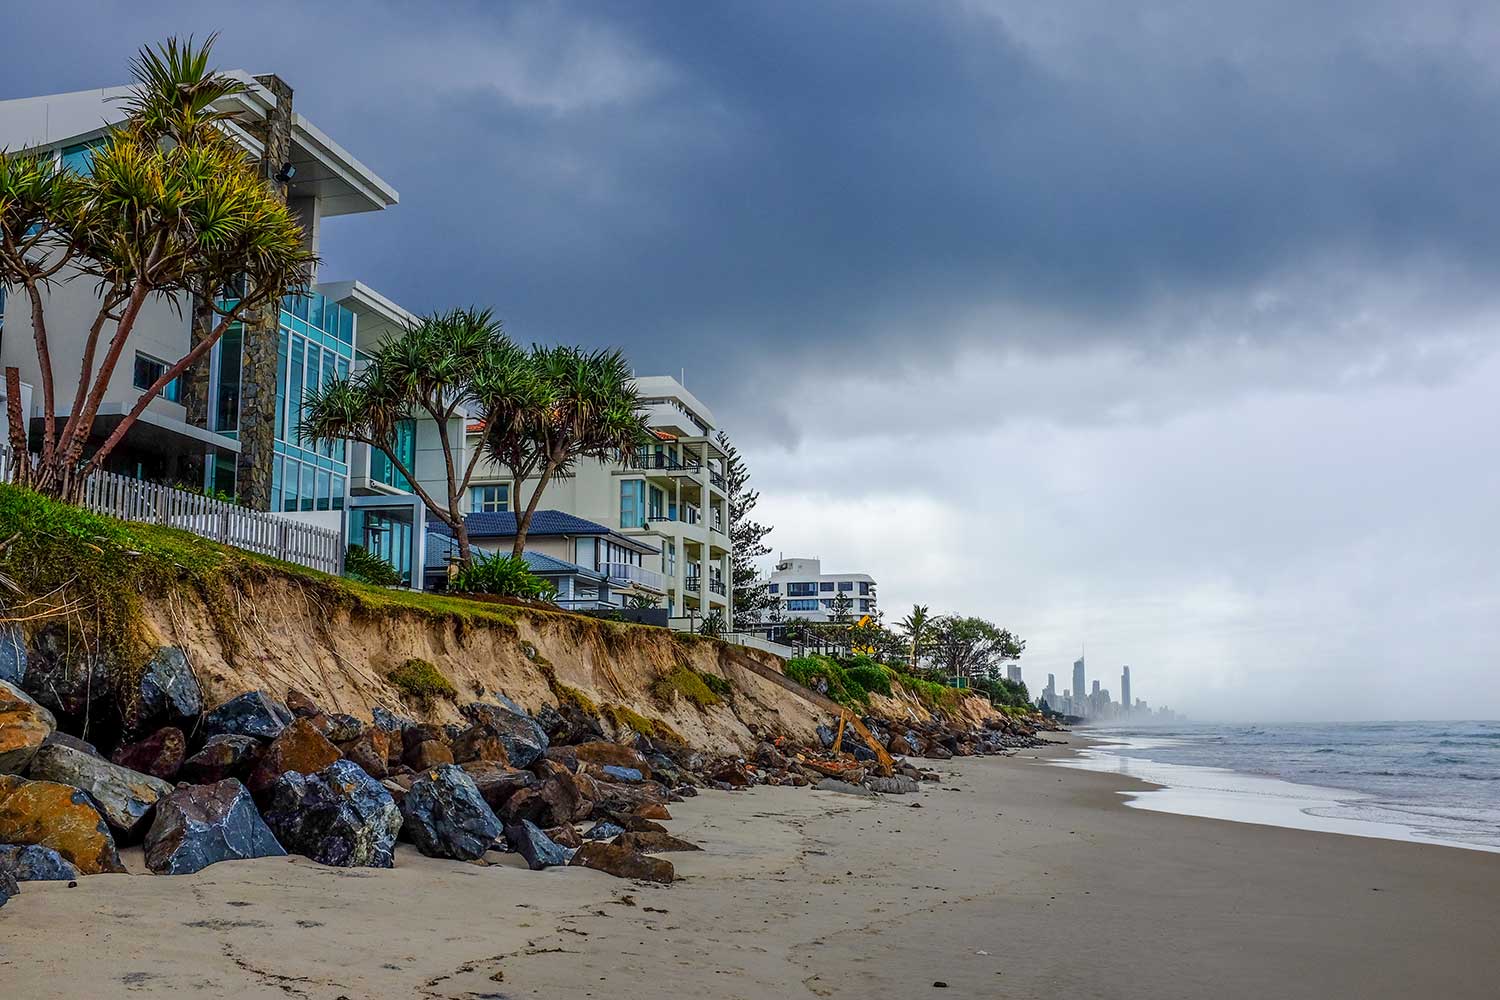
“Healthy ecosystems help to sustain human communities and economies” says Professor Rod Connolly from the Australian Rivers Institute. “Nowhere is this understanding more important than with aquatic ecosystems. Worldwide our waterways are under stress from expanding human populations, which are linked to increased development and land-use change, further exacerbated by climate change. But we depend on these aquatic systems, freshwater, coastal and ocean, for our drinking water, much of our food and employment, and they are where, or near where, most of us live.”

 However, judging whether an environment is healthy is not particularly straightforward.
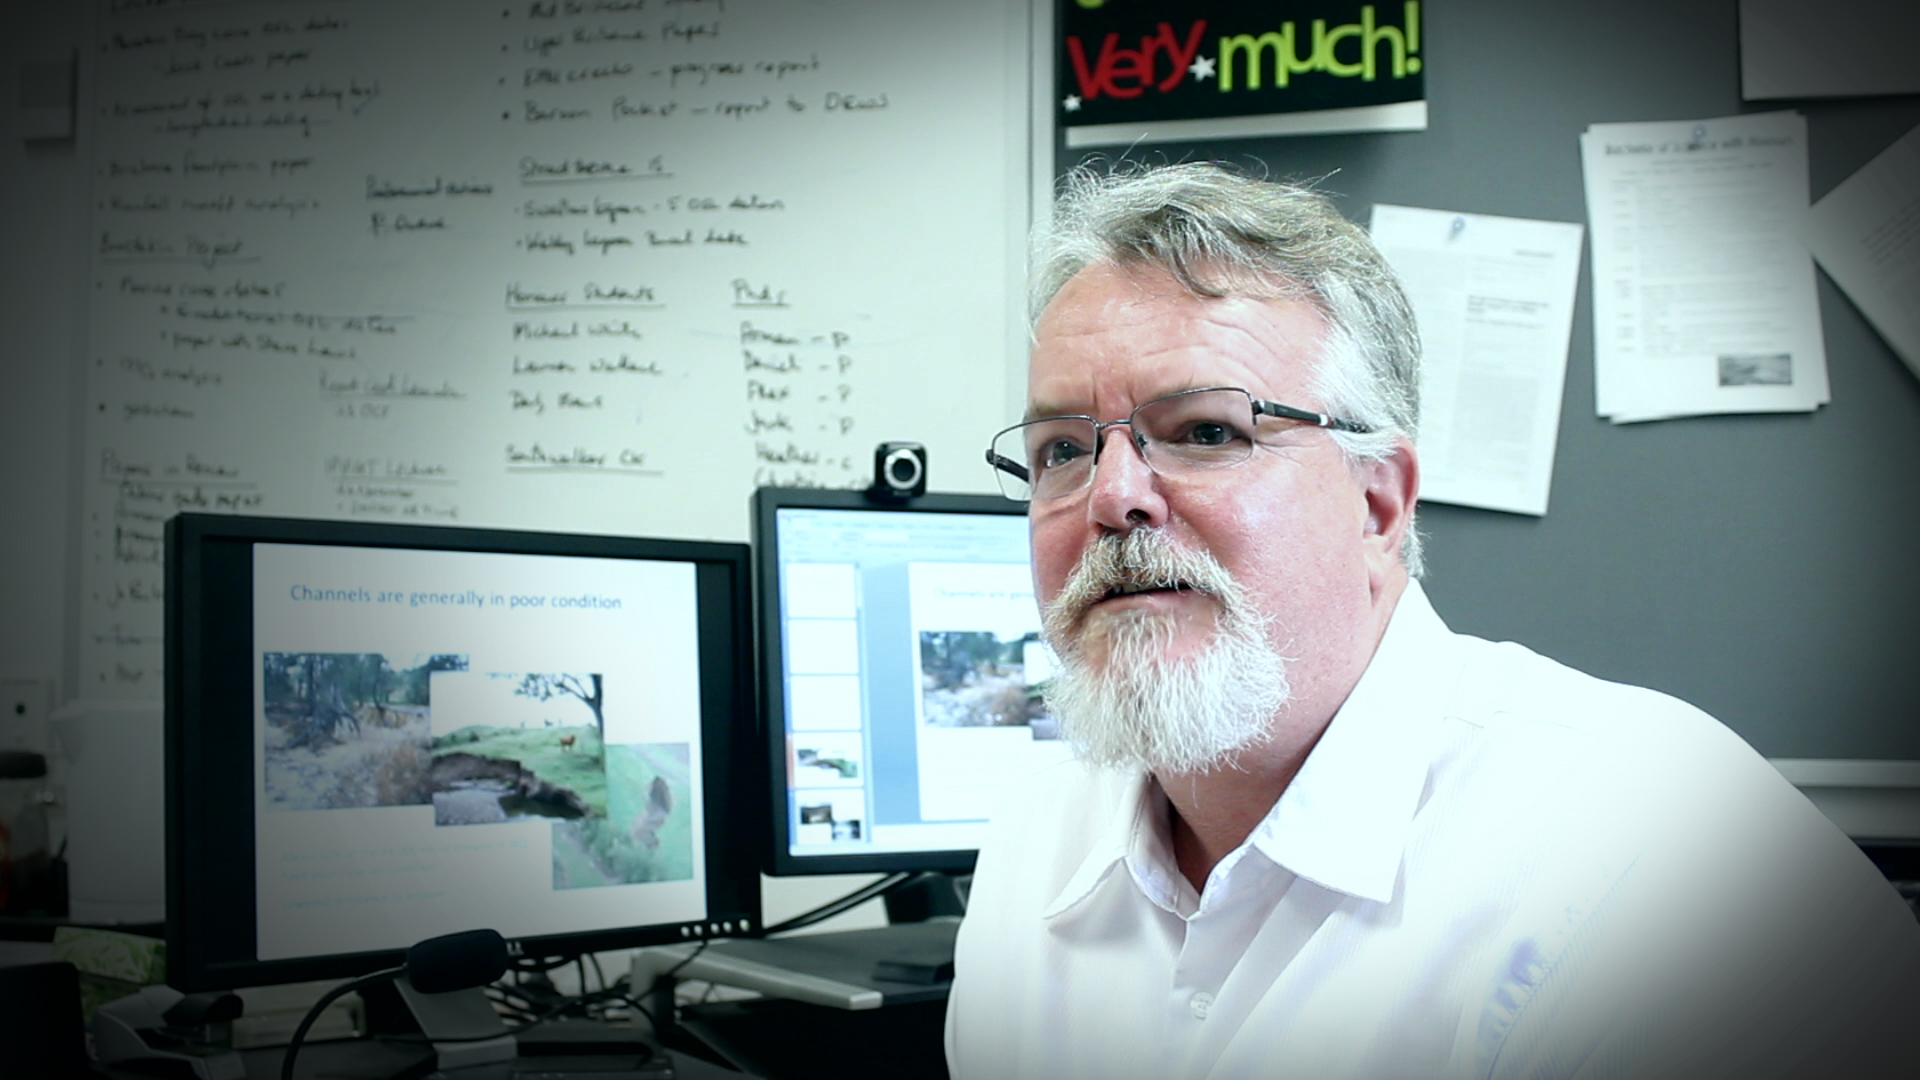
Professor Connolly recently led a team of experts to define the core components and considerations when designing a report card on the health of ecosystems. They have been working to develop the best way to monitor, analyse and most importantly communicate how healthy an ecosystem is, to enable industry, government and the community to make decisions.
“A report card, if done well, can synthesise complex information from multiple sources into a smaller number of scores or grades along distinct themes, and perhaps even an integrated single overall grade, all of which is easily comprehensible,” he says.
Also importantly it gives us a baseline. We have no idea if conditions are improving or deteriorating if we don’t have an idea of the current conditions. It gives a point in time against which, when actions are taken to improve the ecosystem, one can measure change.”
Professor Connolly brought together experts from three universities to complete the study – Griffith University, The University of Queensland and Central Queensland University. They examined how report cards have been used to communicate the results of aquatic ecosystem-health monitoring programs around the world. The review compares and contrasts program frameworks, indicators, resources, communication strategies and links with management. Fourteen aquatic monitoring and report card programs were studied in detail.
This research is being used to underpin the design and develop a report card for Queensland’s largest commodity port, the Port of Gladstone.
An Independent Science Panel has been commissioned to design the specifics of a report card for the Gladstone Healthy Harbour Partnership

Dr Ian Poiner, Chairperson for the Panel, says, “Report cards have become increasingly popular as a way for environmental monitoring programs to provide meaningful and easily understood snap-shots of progress towards specific ecosystem health goals.”
“The work of Professor Connolly and the team has given us the guidelines to ensure that a Gladstone Harbour report card will be world’s best practice providing users and managers of the harbour the best gauge to understand the aquatic ecosystem of the Port and consequently manage it sustainably into the future,” says Dr Poiner.

(Source: Tamar Estuary and Esk Rivers, NRM North)
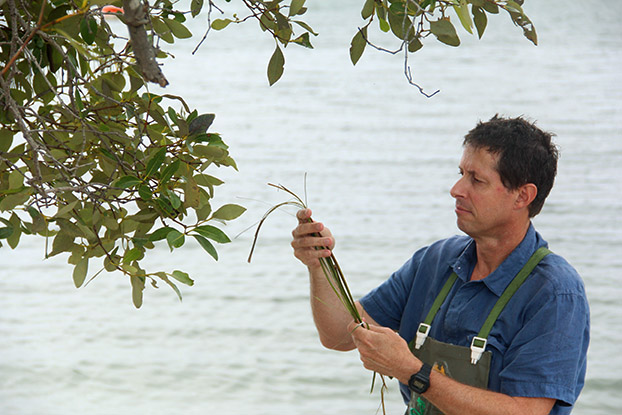
 Combined with the implementation and communication of the report an extremely large array of indicators are used to measure the health of an aquatic ecosystem. Measurements and observations are taken from across the breadth of the ecosystem from observing native and introduced fish numbers to measuring the depth and distribution of seagrass beds to more chemical measures such as nitrogen and phosphorous levels in the water.
“If we design the report card correctly the information is valuable on so many levels: the community has an idea of what is happening in their area, industry can manage their practices to minimise impact on the ecosystem and any remediation activities can be measured to ensure efficacy. The communication to all these different stakeholders can take place across many levels from those wanting a quick snap shot to delving in deeper to really see what is happening in the ecosystem. It just makes the results really easy to understand,” concludes Professor Connolly. 
See here for the detailed report:
REVIEW OF THE USE OF REPORT CARDS FOR MONITORING ECOSYSTEM AND WATERWAY HEALTH.
This review was commissioned by the GLADSTONE HEALTHY HARBOUR PARTNERSHIP INDEPENDENT SCIENCE PANEL to assist in the development of a Report Card Framework for Gladstone Harbour. This review was conducted by a consortium of researchers from Griffith University, University of Queensland and Central Queensland University.


As an aquatic scientist myself, I’ve always been a great fan of the Healthy Waterways report card. It’s possibly the best example I’ve seen of practical, meaningful monitoring done in a way that benefits scientists and communities alike. Keep up the great work guys!